

Disclaimer of Bias
In fairness to all parties (including the reader) it's salient that I point out that I am not the unbiased reviewer I was when working for InfoWorld. In regard to the three solutions involved in this particular review, I'd like to explain my familiarity and bias.
Lancope StealthWatch
I've been staring at a StealthWatch interface since 2002. I used it for a long period of time as my primary incident response and detection mechanism when I was a security analyst in the US Navy. I currently work as a senior systems engineer for Lancope deploying StealthWatch. I am an expert in it's functionality. I am a staunch believer in it's ability to accelerate intelligent incident response and detect advanced/targeted attacks.
Splunk
I am a fan of Splunk and casual user. I routinely connect StealthWatch output to Splunk.
NetFlow Integrator
I am a newbie to NetFlow Integrator. I hadn't heard of it before this last week. I am a novice user and it's possible I missed functionality and/or did not configure the system optimally because of my lack of experience. All available installation and user guides were read and followed during this test. Upon completing my testing I did review my workflows and findings with NetFlow Logic staff to ensure accuracy.
Good Faith
It was my intent to write this article in a fair and informative way. Unlike my days at InfoWorld, I do not have an editor, fact checker, legal counsel or budget to review this article. If you have suggestions or corrections, please message me on LinkedIn, Twitter, via this website or leave a comment below. I would like to thank NetFlow Logic for graciously making their solution available to me for this exercise.
Methodology
In the test environment, I stood up NetFlow Integrator Standard (Build 2.2.0.0.671) on a VM running CentOS. All NFI rules were enabled and forwarded to Splunk. NFI provided its syslog output to Splunk (version 5.0.3, build 163460) running on a separate VM running CentOS. StealthWatch 6.4 ran with a SMCVE and FCVE. NetFlow was fed into both solutions at a rate between 1,000 flows per second and 2,000 flows per second. The input was a mixture of NetFlow v5, NetFlow v9 and IPFIX. In addition to native NetFlow the test traffic was also monitored by a StealthWatch FlowSensor VE. NetFlow was duplicated using a StealthWatch Flow Replicator VE so that each system received the same input at the same time. Each of the following functional checks were run against each product. Throughout the article I may refer to StealthWatch as "SW" and to the combined Splunk and NetFlow Integrator solution as "Splunk" or "Splunk+NFI" or "NFI" interchangeably.
Data Process and Storing
Using NetFlow for incident response or threat detection has a few challenges that network operation focused NetFlow tools do not have to worry about. These challenges need to be addressed by the engine that is cataloging the NetFlow records.
Establishing Client/Server
Compared to packet capture, NetFlow has trouble determining which host is the client and which is the server. If packet capture was in play, the client could be identified as 1) the first host to transmit 2) the first to send a sync (SYN) packet without an ACK flag. Since NetFlow export records are sent to collectors no faster than every 60 seconds, the NetFlow export does not have this precise timing information available. It's also important to note that for every TCP connection there will be at least two set of records. One set will log the data leaving the client heading to the server. The second set will log the data leaving the server heading for the client. In both set of records the host transmitting is called "source IP or src_ip." NetFlow does not log which side is the initiator/client and which side is the responder/server.
In NetFlow terms, establishing which host is the client and which is the server is known as directionality. In order for directionality to work, the first step is to stitch both sets of NetFlow records (client->server and server->client) into one flow object. A flow object is the product of combining multiple NetFlow datagrams into a single data object. Once the flow records have been stitched into a single flow object directionality can be calculated. NetFlow objects can have the following data elements in making that decision:
- Examining which side is using a service (low/server) port and which side is using a ephemeral (high/client) port
- Examining the flag data that is provided in NetFlow
- Examining the direction of the interface (inbound/outbound) that provided NetFlow export
- Examining TTL metrics (in NetFlow v9/IPFIX)
- Examining the byte ratio (clients normally send less data than they receive)
Obviously, none of these are fool-proof so a good NetFlow engine will examine each of them before determining directionality.
The reason directionality is so important is that in incident response an investigation can pivot on whether a host uploaded (sent) information or whether that information was downloaded (pulled by another host.) It also impacts signature based matching and host based behavioral analytics. As I have had occasion to evaluate NetFlow engines I have not found a solution outside of StealthWatch that does this well. I have seen one solution that assigns directionality but it only uses interface direction to calculate directionality. A customer of that solution was recently complaining about the low accuracy rate of the assignment of direction and the investigative headaches it caused. In testing stitching and directionality you can create the following connections that will be logged into NetFlow to check:
- Make a standard HTTP connection as baseline. If this fails, you don't need to continue.
- Use NETCAT to connect on a high service port from a low client port.
- Create routes that have a connection going outbound on one router and returning on another.
- Perform a FTP upload using passive FTP (will pivot to a high port.)
Directionality StealthWatch and Splunk
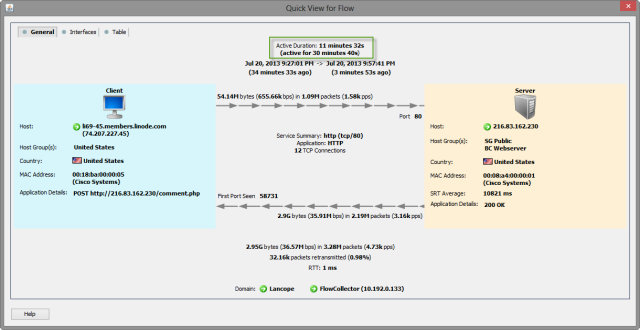
In the following checks I used a SQL injection download (data exfiltration) to evaluated each systems ability to accurately collect, analyze and store communications. For details on this attack see "Phase 2" of Anatomy of a SQL Injection.
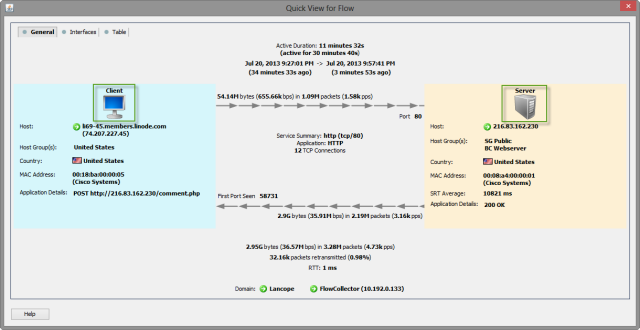
As mentioned earlier, StealthWatch is able to establish client server relationship by building a flow object and evaluating the checks above. By creating a SW Flow Object directionality is easily displayed.
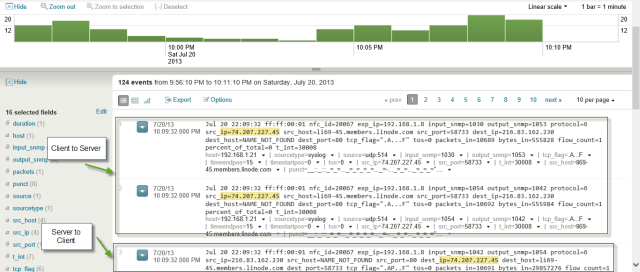
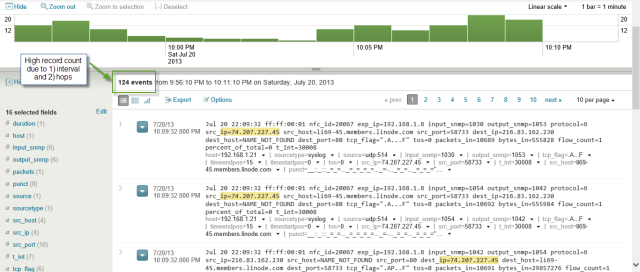
Splunk did not establish directionality. Client to server records and server to client records are logged separately.
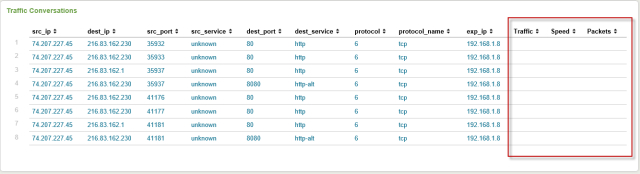
The NetFlow for Splunk Powered by NetFlow Integrator Application is able to determine directionality by reprocessing the NFI created syslog entries. The application failed to properly display/calculate the traffic rates, however. Other issues with the NetFlow application is that it does provide the same detail of communication provided in raw Splunk or StealthWatch. Items like timestamps, host and other columns could not be customized with the current release. Also the power of Splunk Search is lost for workflows like user/AAA log cross queries when using the current release of this application.
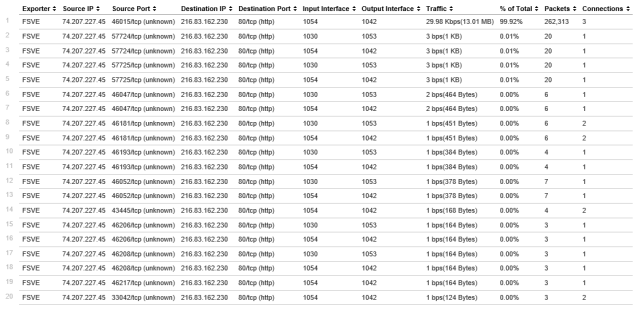
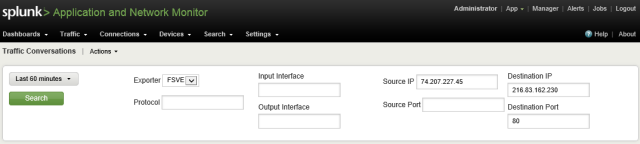
The commerical Splunk application, Application and Network Monitor from NFI, corrected the traffic metrics that the free application had as well as adding metrics on input and output interfaces on the exporter. A&NM shared the same issue of departing from raw Splunk search (correlating AAA and additional flow details) that the free application possesses. It is important to note that the displayed fields are not configurable. Critical fields like start/end times, client/server bytes and NBAR as well as user data cannot be displayed without jumping to Splunk search (and loosing directionality.)
De-duplication
On a given communication, multiple NetFlow records will be created. Some will be created over the duration of the communication and others will be created as it crosses multiple exporters (hops.) The need to merge these records is known as de-duplication. I personally don't care for the term as it implies a wasteful amount of data is being collected. I prefer to call it data merging. I will use the two terms interchangably here. For details on the merits of data merging, note a blog entry from a colleague earlier this year.
De-duplication/merging is easy enough to test against. Just create a flow that lasts more than 5 minutes and routes across multiple interfaces. The ideal system will render a single flow object.
Flow Incrementing
One challenge with accurately processing NetFlow is that flows may last for periods longer than the export. This leaves processing three options 1) don't merge the multiple exports 2) wait until the flow completes to create the log/object 3) increment the flow object as new flow records are received.
In the case of StealthWatch, the third approach is taken allowing for flows that have long durations. Examples of these are large downloads (like our SQL injection), VPN, streaming audio/video and botnet control channels.
NFI takes a unique approach to handling duration. Inside of the system there is a variable (Statistics Logging Interval) that determines how long the flow object is cached in NFI before sending a syslog record of the flow to Splunk. The default setting of the variable is 10 seconds. In my testing I ratcheted it up to 60 seconds. In the case of our 30 minute SQL Injection attack 30 sets of records (30 inbound + 30 outbound = 60) were generated adding to the record count.
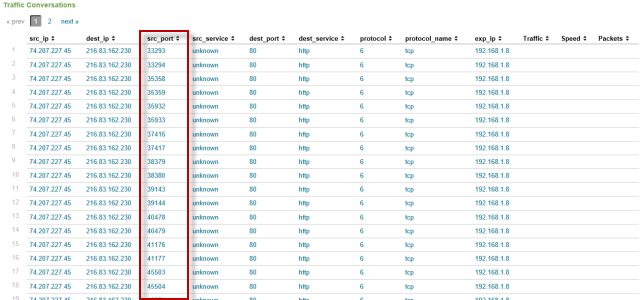
The NetFlow Application laying on top of the NFI input reduced the entries ~25. The major problem for it's deduplication was it's inability to recoginze a HTTP session using multiple client ports (in downloading, HTML, CSS, images, etc.) Additionally, it creates a row for every exporter (switch/router) it crosses. This was also true for the commercial A&NM application.
Interface Merging
In addition to merging updates over time, NetFlow can be generated for every hop it crosses (access, core, firewall, edge, etc.) Each hop adds an additional factor of data coming into the NetFlow processor. Turning off the multiple exporters is generally a bad idea because it 1) removes interface performance metrics for NETOPS 2) decreases pervasiveness of visibility and 3) reduces available data to NetFlow engine for analysis. The evaluated two hop communication in StealthWatch boils all data into a single flow object. Splunk+NFI doubled the records (from 60 to 120.) The commerical A&NM application only allows queries on a per exporter basis.
Querying
Once data is processed and stored, the next test is querying it. When analyzing IOC data both Splunk and SW allow for custom queries. The returned dataset in Splunk+NFI will contain many more disconnected row (for the reasons outlined above) than SW. Details on querying IOC in StealthWatch can be in this blog entry. Standard Splunk querying works with the NFI integration which is by far the biggest argument for deploying it.
In testing querying here are some reports that should be checked:
- Raw query based on data elements (search by IP, port, client, server, bytes, etc.)
- Graphical histograms on service and application
- Top (summary) reports on hosts, peers, services, etc.
- Ability to pivot reports on data elements (from top services to top hosts on those services to top peers of those peers.)
- Report on grouping of hosts (mail servers, by location, policy, etc.)
StealthWatch has all of these capabilities.Splunk+NFI is able to perform much of this. Histograms are limited to high level queries. The lack of host grouping makes queries of common workflows challenging. Examples would be "how much P2P traffic is leaving computers in Atlanta?" or "what are the top peers of mail servers?"
Raw Splunk queries allowed for searching on all data points but had the deduplication ad directionality issues previously listed in the recordset. The NetFlow application only had a small subset of items that could be queried (layer 3, layer 4, exporter and time.)
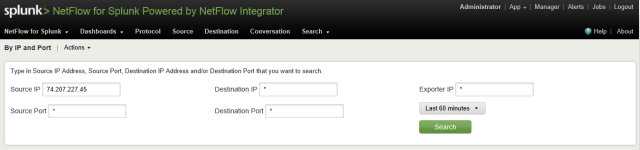
The commercial application required searching across a single exporter but does add the exporter interfaces as a searchable data element.
StealthWatch provides a wealth of queriable data points and also maintains record integrity as listed above. Details on these queries can be viewed in an earlier blog entry.
Threat Detection
In addition to creating a forensic trail of network communications, InfoSec NetFlow tools also have varying abilities to detect threats. In a blog entry last year, I described the two network security detection methods: signature and anomaly. To test the effectiveness of threat detection these are the most common approaches:
- Run recon attacks by scanning segments of the network
- Run attacks with automated exploit tools (MetaSploit, Core Impact, etc.)
- Make connections to C&C server
- Run DDoS attacks using Low Orbit Cannon and Slowloris against test machine
- Craft custom, advanced attacks including insider data theft, spear phishing and custom C&C server
I didn't have time to do an extensive test to compare detection between the two solutions. I limit my observations to what is published as capabilities by each.
Signature Detection
In the NFI engine, flow based rules can be created to monitor for IP, ports and protocol connections. When an event triggers it can send an event into Splunk for aggregation. In a blog entry from last month, I outline how StealthWatch can detect threats based on IP, port, application and application details (URL/FQDN, certificate name.)
Anomaly Detection
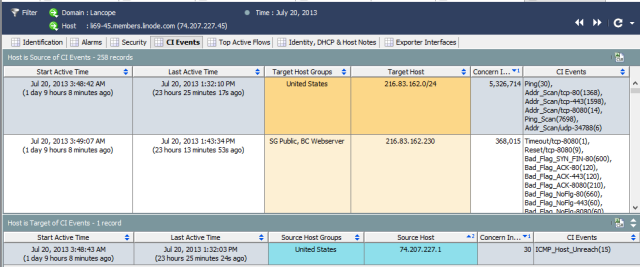
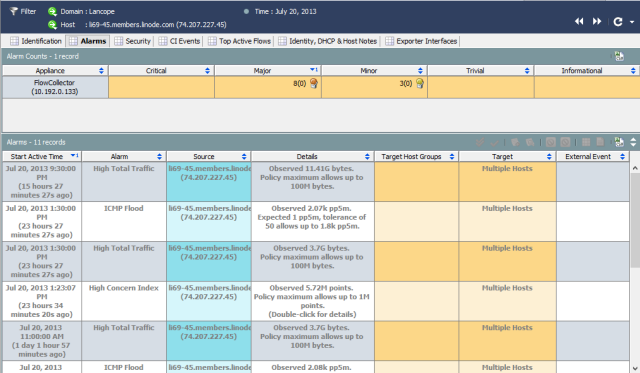
In order to detect security anomalies, a second object needs to be created: the host object. The host object maintains details on how each network host behaves. As anomalous or suspicious activity occurs it is logged on that host object. The hosts behavior is compared with its peers and alarms can be generated. StealthWatch is the industry leader in network behavioral anomaly detection. Below are two screen shots from the SQLi attacker's host object. Showing anomalous and suspicious being detected across several communications it initiated.
Splunk+NFI does not currently maintain host records and consequently can not perform behavioral based analytics that extend past a given communication (signature detection.)
Operationalization
I'm tempted to skip this section all together because of it's ineffable nature, but it most impacts organizational readiness. An InfoSec infrastructure must 1) accurately identify threats and 2) reduce mean time to resolution (MTTR.) Perhaps the best test an organization can perform in deciding on InfoSec tools is how well it actually does these two. In the realm of accurately detecting threats, more is not better. Alarms need to be actionable and in practice false positives tend to cripple operations more than false negatives. One way to approach improving fidelity is moving to a behavior analysis model (from simple pattern/signature matching.) Another is event aggregation. SIEM stand in the space of building "macro-signatures" from multiple data sources. I have strong feelings on where each fit in but I'll table expressing those until a different day. In this evaluation SW stands in the behavioral school and Splunk in the aggregation space.
I will speak a little to MTTR, though. StealthWatch is a custom built UI for the purpose of incident investigation. Most investigations can be time lined and reported within 3 clicks. Splunk (as mentioned earlier) is great at aggregating data and providing a flexible interface for queries. It would be a good exercise to take a SW power user and pit him against a Splunk+NFI power user to see the delta in MTTR on given events. Unfortunately, I don't have the resources to make this happen this weekend so we'll table this as well. After spending a few days in Splunk+NFI, I'm still pretty confident I could easily cut MTTR in a third (or more) using SW over Splunk for NetFlow based investigations (staying mindful of my bias and experience.) SW provides a much smaller haystack. In the case of SQLi, Splunk had 124 times the events that SW had summarized into a single object. The collection of host intelligence also reduces the time needed in investigations.
Other Considerations
In context broader than NetFlow there are some other components that are being discussed.
Single Pane of Glass
I met with a CISO of a Fortune 10 company last week and he wanted a tool that could be a "single pane of glass" for the entire information security infrastructure. I told him I have a similar desire. I want a door that lets me instantly travel anywhere in the world by stepping through it. Neither exists and probably won't while we're in our current jobs. Reducing tools can reduce costs and reduce MTTR. Unfortunately, since a "silver bullet" doesn't exist, the real problem is having the wrong (or too few) tools can increase costs, risk and MTTR. I am a fan of Splunk and it does several things really well. Processing NetFlow is not one of them yet.
User Correlation
User and endpoint mapping to IP data from NetFlow is an important and immerging feature set. In my last blog entry, I laid out how StealthWatch is approaching that. Splunk has always been good at bringing in the AAA data and can connect the NFI generated NetFlow logs in a single pane.
Reputation Feeds
Bringing in emerging threat data feeds and other IOC can improve detection capabilities. Both StealthWatch and Slunk+NFI support this.
Scalability
Both processing and storage of a NetFlow system may be a valid concern. Doing pervasive logging across a global enterprise may generate record volumes exceeding 1 million per second. Ensure the solution being evaluated won't tip over under the load and can handle long term data retention.
Wrap Up
There are several seemingly complex components that need to be evaluated in choosing a NetFlow tool for InfoSec purposes. If deployed correctly and in observance with broader information security infrastructure, it can reduce risk, costs and MTTR.